Tourwriter has partnered with Zoho Analytics allowing you to visualise your Tourwriter data with a sophisticated business intelligence tool. Through Analytics, you can work with your Tourwriter data to generate reports and dashboards once we create a workspace for you.
Each workspace is connected to your Tourwriter database enabling real-time data customisation that syncs every 24 hours.
Entities in Analytics
Let’s take a look at some entities within Analytics:
- Workspace: A workspace encompasses your reports & dashboards. The online data in your Tourwriter database linked to Analytics is available in a Workspace. Tourwriter provisions an initial workspace for your organisation by creating a subset of your data in the form of Tables , Queries & Reports. Tourwriter further controls access to this workspace through Roles and Permissions.
- Dashboards: Dashboards give you an overview of your Key Performance Indicators (KPIs). Your workspace comes with 4 default dashboards.
- Reports: Reports lets you create visualisations. Customise your reports to present data in different chart types. Your workspace comes with 17 Standard reports.
- Data: Your workspace also provides a subset of data from your Tourwriter database in the form of Tables & Queries. Tables present information in a row-wise format.
- Tables: Analytics lets you create reports by capturing data from your Tourwriter database tables. You can create a new report or tweak your existing report by joining multiple tables. The data from your Tourwriter database made available through four default tables are explained in the Workspace Data section. The Query Table option in Analytics lets you achieve just that.
- Queries: You can combine one or more tables from your workspace to create customised reports using standard SQL Select queries.
- Import Data: You can add data to the workspace. Analytics lets you add, say, a google sheet, excel sheet or other data available on a cloud platform. To add data, head to Analytics Home and select Import your Data. With the new imports, you can create visualisations different from ones available in your Tourwriter workspace.
Signing up to Zoho Analytics
As soon as you agree to the 7-day free trial, you receive a Welcome to Zoho email requesting you to confirm your email. Before you confirm your email, sign-up to Zoho to ensure the Data Centre you choose is the same as the one the Tourwriter staff is on. Only then would you have access to the workspace. Here are the steps to sign-up and choose the correct Data Centre:
- Before confirming your email address, access the Zoho Analytics sign-up page: https://www.zoho.com/analytics/.
- Enter the email address you received the email on.
- Choose a strong password.
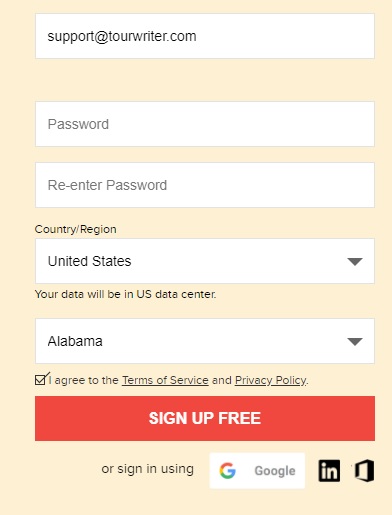
- Based on your location, Zoho Analytics chooses the nearest Data Centre automatically. Override it by clicking Change, as shown below:

- Select United States as the Country and Alabama as the Region.
- Agree to the Terms of Service and Privacy Policy after going through it.
Closing your account to sign up again
If you already have signed-in and do not have access to the workspace, close your account and sign up again. Here are the steps:
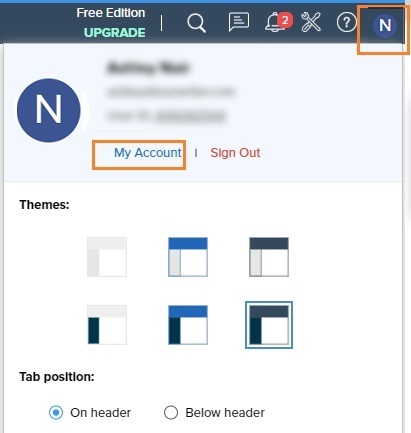
- On your Analytics account, head to your account by clicking your pic in the top-right corner.
- Under Settings, in the left panel, select Close Account.
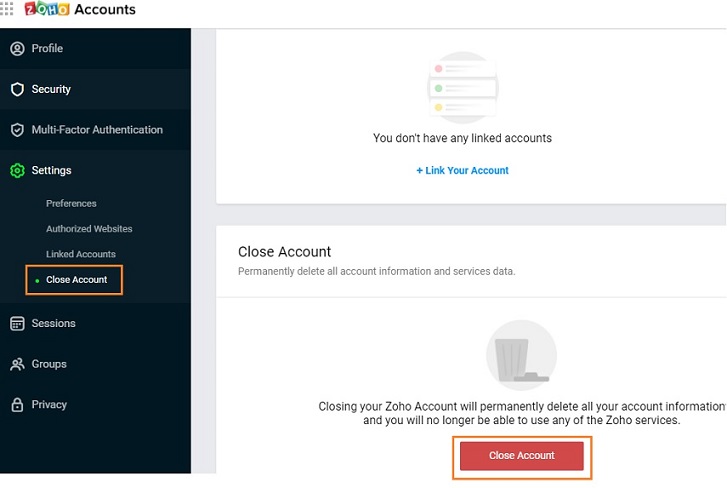
- Once your account is closed, go to https://www.zoho.com/analytics/ and sign up again. Follow steps 1 through 6 in Signing up to Zoho Analytics.
Note: Ensure you change the Country/Region to United States and Alabama before you sign up as detailed previously.
Roles within Analytics
Analytics deploys role-based access management. There are different User Roles in Analytics. Let’s take a look at them.
- Workspace admin – A workspace admin is ideally a Tourwriter staff who manages the workspace. They have control over the workspace settings, which include managing users, creating/modifying reports and dashboards and so on. They can assign the User role to a member of your organisation and further choose to forward shared data with other users in your organisation.
- User -. A user has permission to view Dashboards/Reports that are shared with them.
- Copying data– Although a user cannot directly modify reports and dashboards shared by the workspace admin, they can create copies. To create a copy, open a report or a dashboard and click the Options menu (three vertical dots) to see more. Select Save As to expand the Save As window. The name defaults to the original name and the suffix -Copy. Select the folder to store the new copy in the Save in Folder dropdown. Add an optional Description and click OK to save the changes.

- View access – A user with View access does not consume a user licence and has Read-only access to reports/dashboards shared with them.
Note: Tourwriter creates one user per organisation. A user is designated the User role at the beginning. To create additional User roles, please reach out to us.
Standard Visualisations in your Workspace
Your workspace presents visualisations by aggregating information from your database. Data from your database is available in tables in rows and columns format.
Workspace Data
Your workspace comes with standard Reports and Dashboards that are fetched from tables stored in your workspace. These tables are synced from your actual database based on your sync preferences set in your workspace. The table stores information as below:
- Itinerary information: A summary of all your itineraries.
- Detailed Itinerary information: Booking level itinerary details
- Task information: Your tasks information present on the Itinerary tab.
- Supplier level information: Detailed supplier information, including services and rates.
Configuration & Sync settings
Data in your Analytics workspace syncs with your Tourwriter database every 24 hours. Talk to us if you wish to sync your data from the database every few hours. You can go through the Zoho Analytics help files to learn more about creating Reports and Dashboards. You can also go to DataSources and add custom visualisations to your workspace. The Tourwriter Support team can help you to create new visualisations at a standard fee of $90 /hr NZD.
Standard Reports
Let us go through some of the default reports available in your workspace.
- Itineraries count by agent report: This report indicates how many itineraries each agent has worked on.
- Itineraries per Country report: The report specifies the number of itineraries occurring in each country. The report further lists the gross amount of the itineraries along with yield amount for each country.
- Itineraries per Service Type report: The report provides a visual overview of the totals for bookings, Gross Final sales and Itinerary yield.
- Itineraries per Source report: The report provides details of where the booking arose from. The values correspond to that in the Source field on the Itinerary tab. For each Source, the report provides the total itineraries sold, the Gross Final sales total and the Yield total.
- Itinerary Yield by Agent report: The report displays the total Yield generated per itinerary. It provides a simple and effective way of seeing how much yield a specific user has generated.
- Supplier Rates report: The report enables you to see the gross rates you have loaded for every supplier over a specified date period. It also provides details of the date period the rates are valid for.
- Task List: The report displays pending tasks in all your itineraries. It continues to sort by the task owner, which can be found under the Assigned To field. If a task is unassigned, then the itinerary owner is considered the task owner.
Note: The Itinerary per Source and Itinerary per Country reports have a YTD (Year to Date) variant that displays the itinerary information by each year. To create your charts in Analytics, refer to How to create Charts.
Standard Dashboards
Dashboards combine your reports and present a single customisable layout. Dashboards give you an overview of your Key Performance Indicators through widgets. It also allows you to combine multiple reports into a quick overview. To learn more about creating Dashboards, refer to the Zoho Help file. Your default dashboard comes with the following pre-loaded dashboards:
- Agent Dashboard: Displays the total Yield and Gross Final value for all agents in your database. It also lists the passenger count. You can filter data to see the total passengers assigned to each agent. You can also filter stats for each agent and view data for a date range.
- Sales Dashboard: View the total itinerary gross final and total itinerary yield for the entire duration.
- Supplier Dashboard: Displays the total Gross Final, Net Final, Itinerary Yield and Commission for all your Suppliers. You can filter stats by supplier, agent, itinerary and arrival date.
- User Dashboard: Shows stats for your Tourwriter users. Lists the total Itinerary Gross Final, Passenger count, Itinerary yield for all users. Besides, it also lists the Average Itinerary Gross Final, and Itinerary Markup Percentage. You can filter stats by each user, and by a date range.
Drilling down data
Using the drill-down feature, you can dive deeper into your data and gather useful insights using a specified path. This drill-down path is a sequential list of data columns from your data tables. To drill-down, you can click on any point on a bar in the report, and visualise the underlying data as a new report. Refer to steps in How to drill down your data to learn more.